
In semi-recent news, the Federal Housing Finance Agency increased the lending limit on conforming loans for 2024.
Understanding the HECM Program
The Home Equity Conversion Mortgage (HECM) program, integral to many homeowners, particularly seniors, has undergone significant changes in recent years. This analysis delves into the recent increase in HECM lending limits, exploring its implications and underlying causes.
Exploring the Rapid Increase in HECM Lending Limits (2016-2023)
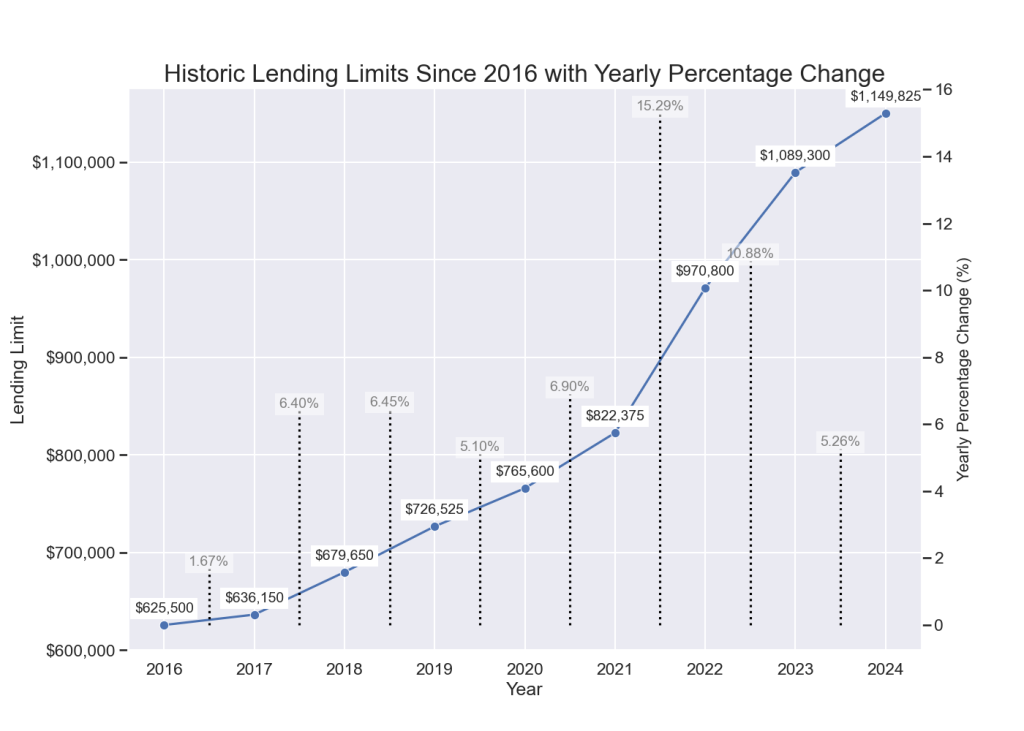
Since 2016, HECM borrowers have witnessed a dramatic surge in lending limits. From $625,500 in 2016 to an impressive $1,149,825 in 2023, this near doubling over seven years signals a noteworthy shift in the housing finance landscape.
Factors Contributing to the Increase in HECM Lending Limits:
The reason for the significant increases in HECM lending limits has to do with a few ancillary details of the HECM program and overall housing market, that have come together to create a meteoric rise in lending limits:
- Adoption of High-Cost Area Conforming Loan Limit
Established by Mortgagee Letter 2014-25, HECM loans transitioned to using the conforming loan limit for high-cost areas, rather than local lending limits. This significant shift, initially a one-off measure, has now become a standard practice, substantially affecting lending limits. The lending limit for the high-cost area is 150% of the non-high cost area, meaning that a HECM borrower in a non-high cost area is eligible for 150% of the lending limit compared to a non-HECM borrower in the same area. - Lending limits are statutorily adjusted annually
The Housing and Economic Recovery Act of 2008 mandates annual adjustments to lending limits. These adjustments are tied to the housing price index maintained by the Federal Housing Finance Agency, reflecting changes in the real estate market. - Significant home price appreciation
The alignment of lending limits with the home price index means that rising home values directly influence HECM lending limits. This section will further explore the correlation between home value appreciation and lending limits.
Home Values: Analyzing the Trend
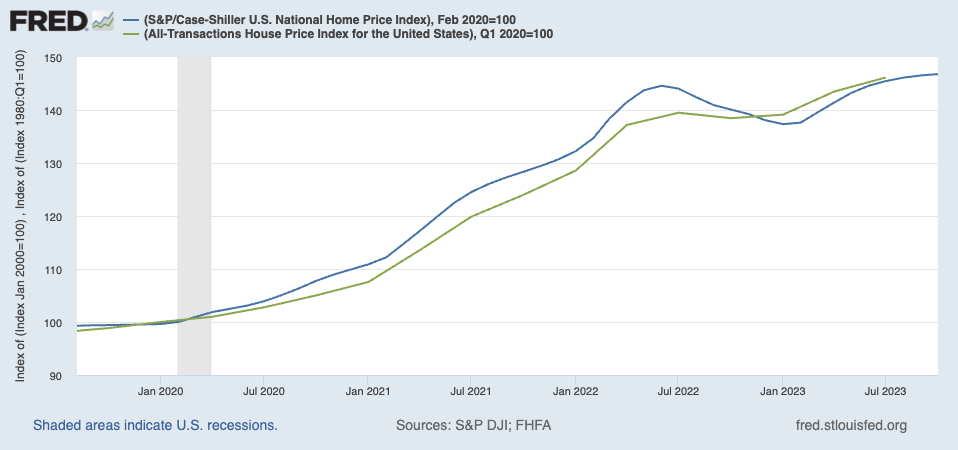
As of June 2022, home values peaked, subsequently fluctuated, and recently attained new highs in early 2023. This section presents an in-depth analysis of these trends using the Case-Shiller Index and the FHFA Home Price Index, accompanied by visual representations for a clearer understanding.
Is the U.S. on the brink of another housing crisis?
While a detailed analysis will be written at another time, preliminary insights suggest a divergence from past patterns of investor over-exuberance and hyper-availability of credit seen in the dot-com, housing, and tech stock bubbles.
Home price appreciation is widely believed to be due to a supply-side shortage, and investor sentiment toward residential real estate has remained modest since the beginning of the Federal Reserve’s rate hiking campaign in 2022. At the same time, the availability of credit has been meaningfully lower, suggesting that the required conditions for a housing bubble simply are not being met.
Diminishing Impact on Borrowers: A Closer Look
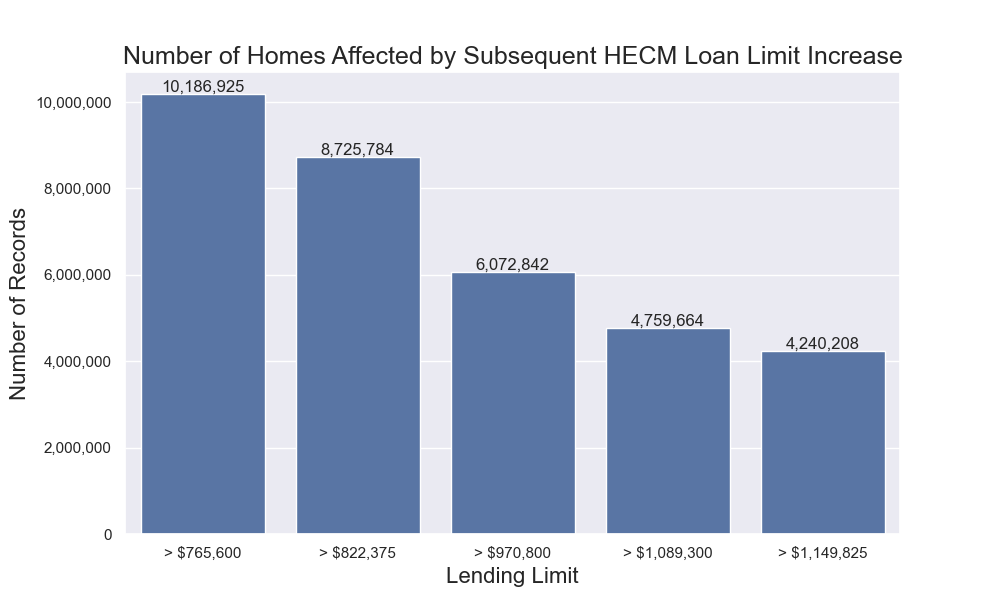
Despite the increase in lending limits being a boon for loan originators, its impact on homeowners is nuanced. This segment examines how the recent changes affect borrowers, especially in terms of property values surpassing the new limits. Across our data, there were over 10 million homes affected by the home value increase to $765,000, but the increase to $822,375 had only 8.7 million homes affected. This downward trend of the number of homeowners impacted continues with each subsequent increase in the lending limit.
To determine the impact that the increase in lending limit has on borrowers, we consider the number of homes that have final value estimates above the each lending limit.
Conclusion: Key Takeaways and Future Analysis
In sum, while the HECM lending limit increase reflects broader market trends, its impact varies across different borrower segments, with each subsequent increase having a smaller marginal effect. Future research may focus on longer-term implications of lending limit increases on the FHA’s mutual mortgage insurance (MMI) fund and the impact of proprietary (private) reverse mortgages to fill the role.