I think everyone in the reverse mortgage space has probably heard these anecdotes:
- “As borrower age increases, the amount of money the borrower qualifies for increases”
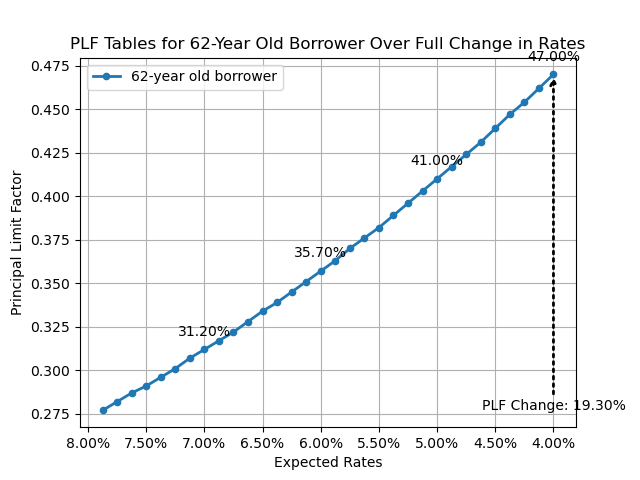
- “As interest rates decrease, the amount of money the borrower qualifies for increases”
It’s time to bring these concepts to light with graphical clarity.
Uncovering Multivariate Non-Linear Relationships
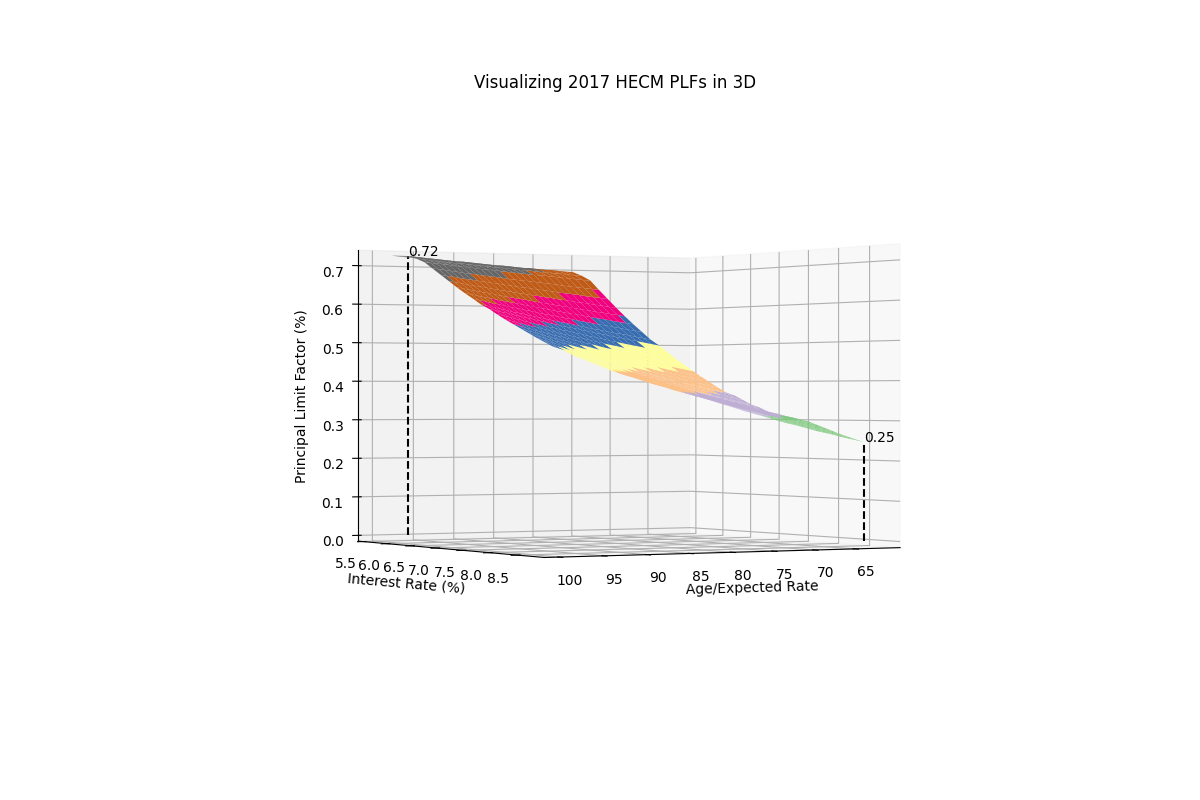
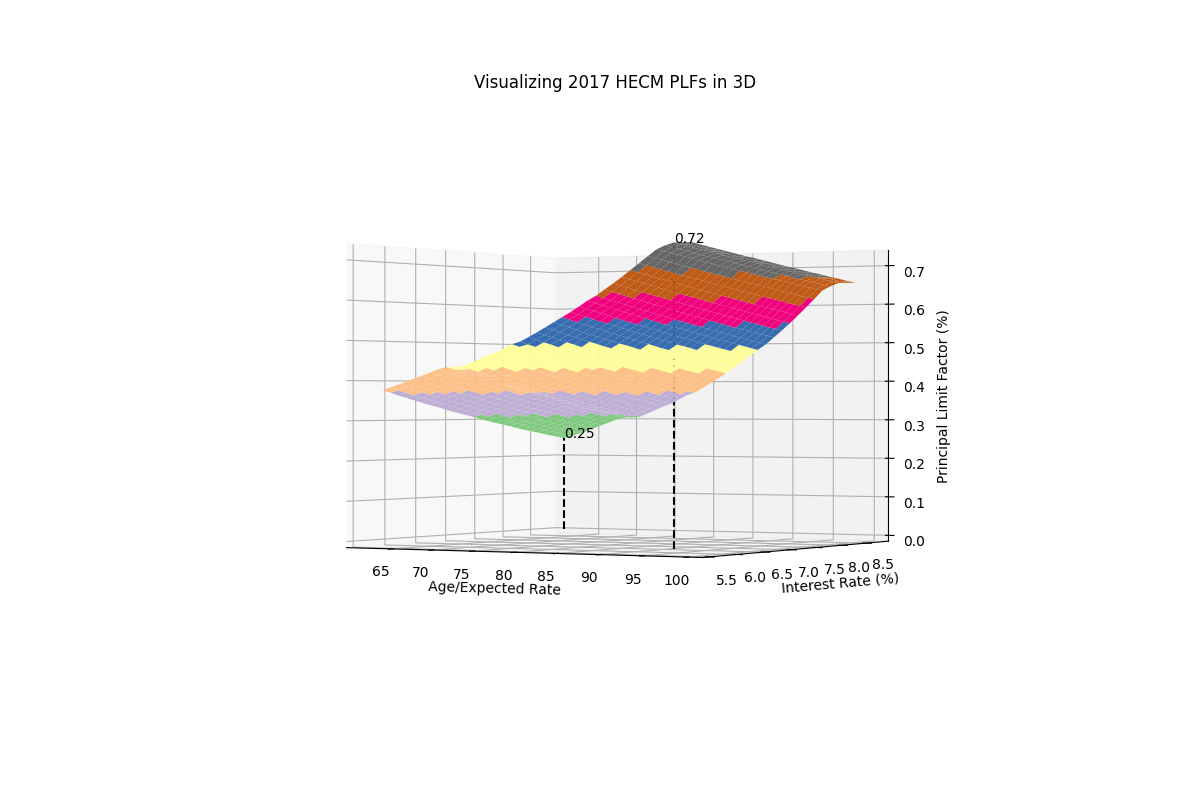
Through 3D graphical representations, we can observe some intriguing patterns:
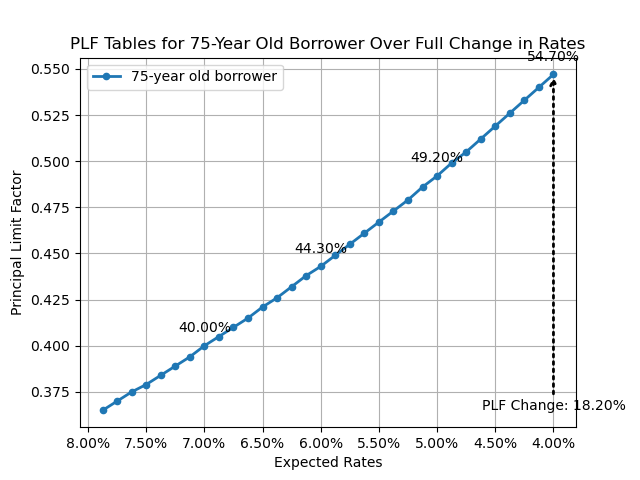
- Interest Rate Sensitivity Varies with Age: Younger borrowers are disproportionately affected by higher rates. Yet, this isn’t a straightforward linear relationship.
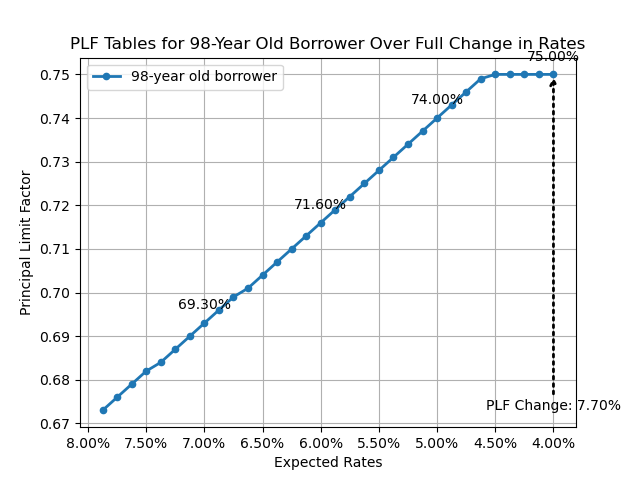
- Age and Principal Limit Factors (PLFs): As borrowers age, PLFs increase, but not uniformly. There are specific age thresholds where these increases plateau.
Simplifying with 2D Projections
For those finding these 3D graphs a tad overwhelming, worry not! I’ve projected these insights into traditional 2D graphs for easier consumption.
Why it matters.
Understanding these concepts is crucial for anyone in the reverse mortgage space. It aids in better advising our clients and tailoring solutions that align precisely with their needs.
CONTINUE THE CONVERSATION
Comments
Have a different take, a question, or experience to share? Add your perspective.